Evaluation of noise in flared ports
Subwoofer ports have to flow a lot more air than their conventional speaker counterparts.
Since increasing the area of a port quickly produces very long ports, the most effective means of moving more air is
to increase the air velocity.
Ports operating below about 10 m/sec generally have no problems with turbulence and compression.
As velocity is increased beyond this, turbulence occurs as air exiting the port is forced to slow too quickly as it
encounters the surrounding still air.
Flared ports cause the airflow to expand and loose speed in a controlled fashion, allowing higher speeds without turbulence.
This method targets the air in the "boundary layer", which is close to the walls of the port.
Increasing velocity even further, the air in the "core" of the port becomes turbulent. Flares are unable to help with this
problem, which represents the limiting velocity for the port. By this stage the port is beginning to present a different
load to the system, resulting in de-tuning and subsequent loss of output, known as compression.
A series of experiments were done to quantify this behaviour ...
ROUND ONE, concentrated on a range of 86mm ports operating at 30hz only, and measured how usable velocity increases with flare size.
ROUND TWO, duplicated these findings for 103mm ports, and more importantly, measured the limiting velocity for both diameters.
In addition, changes in performance at different frequencies were investigated. Several measurements were also taken for 152mm ports.
ROUND THREE, examined whether the inside flare could be smaller than the outside flare, without affecting performance.
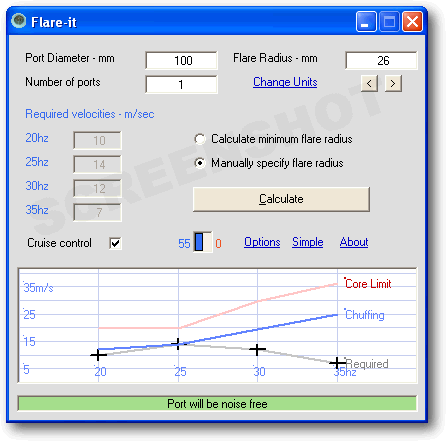
All the results are incorporated into the downloadable Flare-it calculator
Summary of findings
- Maximum usable velocity increases linearly with Area Ratio
- There is a limiting velocity for any given diameter port, regardless of flare radius
- Larger diameter ports have a higher usable velocity than smaller ports
- Port performance varies with frequency
- For moderate usage, the inside flare can be slightly smaller than the outside one
A couple of definitions to clarify terms used in these experiments
Area Ratio

Area Ratio is defined as the cross-sectional area (CSA) of the port opening, divided by the CSA of the unflared section of the port. It gives an indication of how quickly the air has to change velocity as it exits a flared port, and is a more useful measure than flare radius alone. It allows comparisons to be made for ports of different diameters, and is the measure used to describe the ports used in these tests.
Chuffing:
Chuffing is defined as "any audible noise, other than the intended signal, detected by listening with the ear close to the port"The onset of "chuffing" is unmistakable and a change of 1dB in input power is usually enough to hear it clearly. Where the transition occured over a range of values, the average of "I think I can just hear it" and "I can definitely hear it" was recorded
I'm confident that anyone who repeated the tests would find their results very close to those presented here. Even if a different threshold for chuffing was chosen, the relationships found in these tests would still be present.
The main area of subjectivity is in deciding how to translate results based on barely audible chuffing, into recommendations for typical music and home theater applications.
A test was done to see how much the port velocity could be increased before the "chuffing" became audible at the seating position.
For a seat 2.5 metres from the sub in a room 5m * 4m, the velocity could be increased by 25%.
An allowance for the masking effect of content can also be used.
The actual amount is based on the performance of sub's I've built, and on existing industry recommendations.
I estimate that reasonable values for masking allowance are an additional 15% for music and 30% for Home Theatre usage.
The equations developed below are based on designing for music, so a total allowance of 25+15 = 40% is used
Testing Method
Voltage measurements to determine input power
A sine wave was applied to each port / flare combination, and the signal
level slowly increased. Care was taken not to use high power for longer than several seconds,
particularly for the 30hz tests (at the tuning frequency excursion is at a minimum = less cooling)
When "chuffing" was first detected, the voltage across the drivers was recorded.
From the voltage, the input power was calculated as detailed next:
According to the WinISD support notes, input power to a speaker can be determined by the following formula:
Input power = RMS voltage squared / DC resistance of coil
Voltage measurement should thus give an accurate means of determining input power,
and in conjunction with modelling in WinISD, determining SPL and port velocity.
This neatly bypasses any problems with room nodes that can occur if an SPL meter is used.
The approach was discussed with members of the diyAudio discussion forum, and with the WinISD support forum.
Reality Check
A test was done comparing
SPL determined by
voltage measurement, against SPL measured with an
SPL meter.
An existing sub was measured at 30hz, outside, on the edge of a deck,
with the acoustic centre 1.25m above ground, and the SPL meter 1m away.
Simultaneous measurements of SPL and voltage were taken.
The SPL was 92dB, as measured with a Radio Shack SPL meter
Adding 3dB correction for the analog Radio Shack meter @30z, gives a measured SPL of 95dB
The voltage across the drivers was 11.5V RMS, measured with an analog multimeter.
The DC resistance of both drivers in series is 7ohms
Calculated Input power = RMS voltage squared / resistance = 18.9 watts
Put 18.9w into WinISD and read off SPL @ 30hz = 102dB
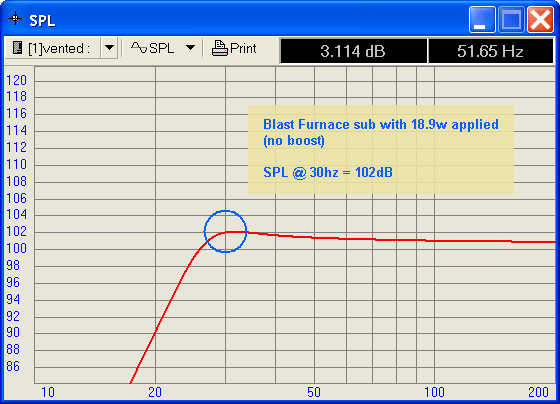
To accurately specify the input power at 30hz, the modelling in WinISD is done without any amplifier boost factored in.
This SPL figure given by WinISD is for measurement in "half-space".
Since the test was done outside with the speaker 1.25m above the ground, and the meter 1m away, a "full-space" value for SPL is closer to what will be measured
To convert a "half-space" SPL to an equivalent "full-space" value, subtract 6dB.
This gives the SPL as determined from voltage measurement of 96dB
With the SPL being within 1dB for the two methods,
we can see that voltage measurement is an acceptable method for determining input power and thus SPL
Test Ports and Boxes Details
Fifteen ports were tested for a range of frequencies. (15, 20, 25, 30 and 35hz,
power and excursion permitting ) The ports ranged in diameter from 51mm to 152mm, and the flares ranged
from 10mm to 75mm.
Several boxes were required to optimise velocity and port length for the
different port diameters. Round one utilised 50 litre box with two 10 inch drivers.
Round two used a four-driver box that could be configured for 70, 100 or 160 litres.
For round one of the testing , seven test ports were built

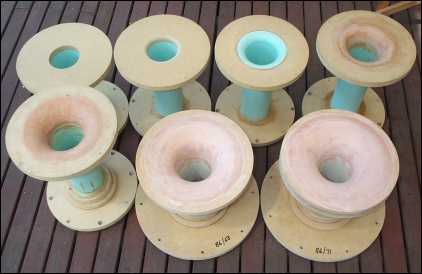
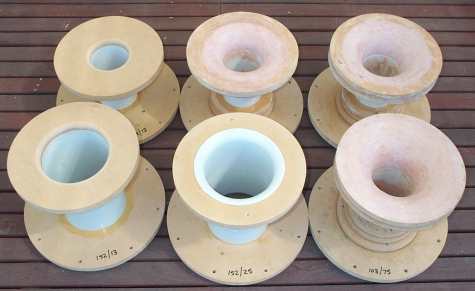
The ports are made from PVC pipe, with a 270mm flange at each end. One or more smaller supporting rings are utilised, depending on the construction of the actual flare.
The MDF pieces were glued together with PVA glue, and the PVC pipe was glued into the MDF with epoxy resin.
The mounting end of the flare has a bolt pattern the same as a 10 inch driver, and is stepped so that the flare lines up with the inside face of the box.
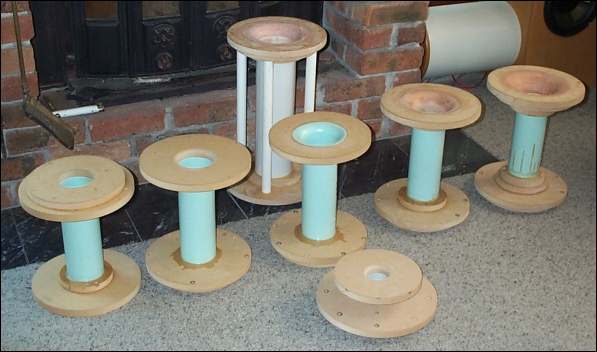
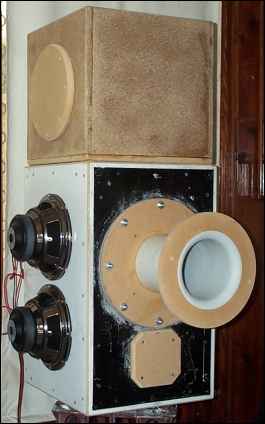
The ports have a stepped mounting flange so that they line up flush with the inside face of the box, as shown in this picture.
For round two of the testing, another eight ports were built.
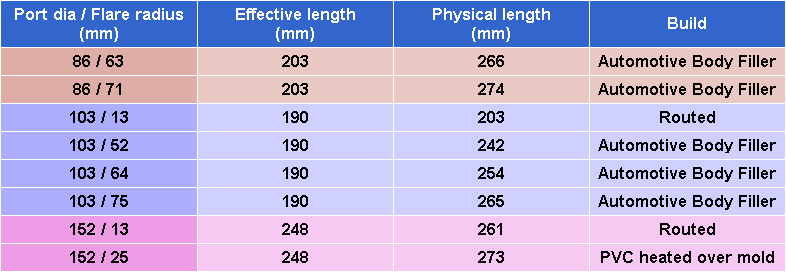
The same construction method was employed for the round two ports, except that a larger 360mm mounting flange was required
Test Boxes
Several different test boxes were built to test the range of flared ports
To achieve a high enough velocity to test the larger ports, the size of the test box was increased as the port size increased, but there were several conflicting principles:
- The port had to flow enough air to generate turbulence with the largest flare fitted
- The tuning frequency for the port should be in the normal operating range of a subwoofer - 30hz was chosen
- The port shouldn't be too short, which might lead to an "all flare and no port" situation. To have a reasonable length straight section when testing large flares, a small box is desirable
- To have a high enough airspeed to test larger flares, a large box is desirable
The solution was to use several different sized boxes.
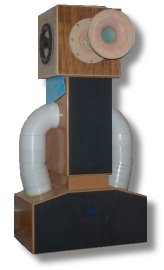
Round one tests used a 50litre box and had a pair of
10inch drivers driven by the Jaycar 350w amplifier. Into the 7ohm load presented by the two drivers in series, it delivers up to 240w.
The test port is mounted externally and is forward firing, whilst the drivers are located on each side.
Foam gaskets were used under the drivers and the port. The port was mounted with eight roofing screws,
which, along with a cordless drill, made changeover time much easier.
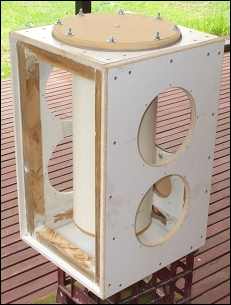
Round two tests used a 100litre box which started life as the very first subwoofer I built. Four 10 inch drivers mount to the sides and a 255mm opening for the port is at the front. An identical opening at the top allows fitting of a plain plate, a 50 litre add-on box, or a 30 litre reducing cylinder. Both openings have foam gaskets and eight studs - this proved much more durable than the roofing screws used with the round one tests
WinISD Project Files
50 litre box - small 86mm ports70 litre box - large 86mm ports
100 litre box - 103mm ports
160 litre box - 152mm ports
Results for 30hz
See raw data page for the voltage measurements, power calculations and alternate frequency results
Graphing the data for all fifteen ports, highlights the limiting velocities and linear relationships
Light grey shaded area indicates round one results
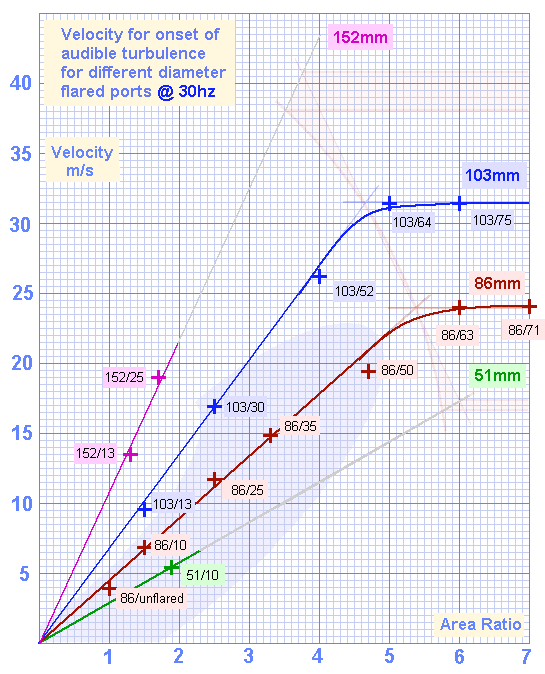
The measured figures are for just audible "chuffing" detected by listening at close range
As stated above, an additional 40% of input power can be utilised for listening to music.
This 40% allowance isn't applied once the limiting velocity is reached, because core turbulence begins to cause compression and de-tuning.
A graphical approach was used to add this allowance, and then find equations describing operation at, and below the limiting velocity.
The following set of equations were developed. >> more (Part one)
Limiting velocity at 30hz (onset of core turbulence and compression)
For ports smaller than 103mm in diameterLimiting velocity = 10 +[ (diameter squared) * (19.5 / 10,000) ]
For ports larger than 103mm in diameter
Limiting velocity = 31 + [(diameter squared - 10,600) * (8.5 / 15,000)]
Usable velocity at 30hz when operating below the limiting velocity (onset of boundary layer turbulence or "chuffing")

The ports were tested for a range of frequencies. (15, 20, 25, 30 and 35hz, power and excursion permitting )
It was found that departing from the 30hz test frequency changed the usable velocity.
Here's the results for the 86mm diameter ports.
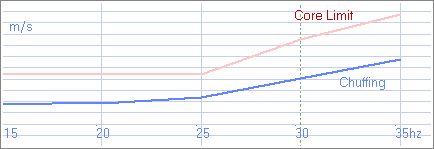
The limiting velocity falls as frequency is reduced, stabilising at 25hz
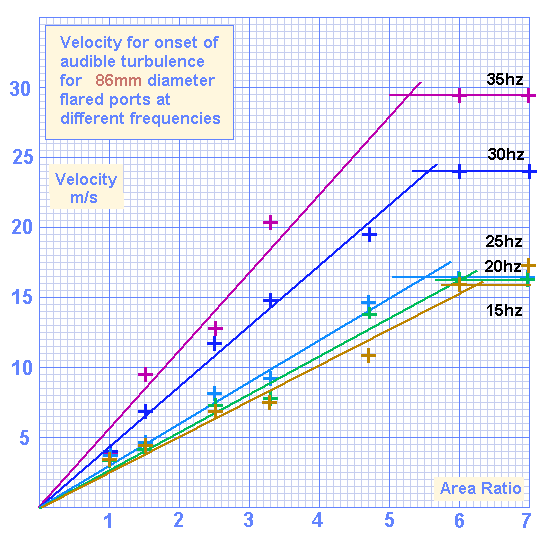
From this data, plus that for the other diameters, the following set of relationships was developed. >>more (Part two)
Limiting velocity
At 35hz, the limiting velocity is higher than the 30hz figure by +23%.At 25hz, and below, the limiting velocity is lower than the 30hz figure by -33%
Usable velocity
At 35hz, the usable velocity is higher than the 30hz figure by +29%At 25hz, the usable velocity is lower than the 30hz figure by -28%
At 20hz, the usable velocity is lower than the 30hz figure by -37%
At 15hz, the usable velocity is lower than the 30hz figure by -44%
These results can be visualised in the following graphic. The spacing between the two lines will depend on what flares are fitted
Inside flare requirements
The third round of tests examined whether the inside flare could be smaller than the outside flare, without affecting performance.
All the test details can be found in Part 3 and conclude that:
For speeds below 70% of the core limit, the radius of the inside flare can be 15 - 20% smaller
than that of the outside flare
At last, the tool
The findings of these tests have been incorporated into the Flare-it calculator

