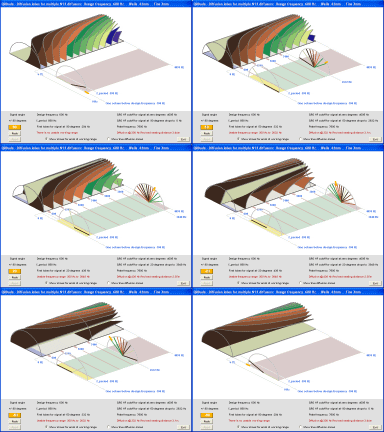
QRDude User Guide - Lobes for multiple panels
When multiple QRD panels are used side-by-side, the repetition of the panels produces grating lobes. The pattern of these lobes takes precedence over the diffusion pattern of the underlying single panels.
This guide to QRDude's Lobes screen is divided into three sections:
- The first section explains how diffusion lobes are formed by repeats of periodic surfaces, and how they change with frequency
- The second section looks at how the scattering and diffusion ranges of the underlying QRD panels controls how the lobes are energised
- The third section looks at how how the lobe distribution and HF cutoff frequency change for signals that are not straight-on to the panels.
Recap
Here is the graph of QRD diffusion that was presented on the qrd overview page...
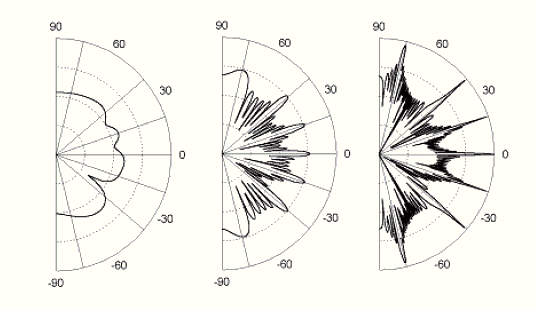
Diffusion lobes for groups of standard N7 diffusers at the HF cutoff frequency for 1, 6 and 50 periods respectively
Original pic: RPG, Values for number of panels taken from Naziema Joeman thesis
You might look at the first of the three graphs and conclude that a single panel has more even diffusion
than multiple panels. Why not just use them stand-alone?
The answer lies in the QRD's main claim to fame - even enegy diffusion in all the lobes.
- The lobes are ONLY PRODUCED when multiple panels are used, and the even energy seems to only be available at multiples of the design frequency.
- For stand-alone panels, the lobes dont exist. Diffusion is generated by the interraction of the well depths, but the energy will not necessarily be even in all directions
- An array of multiple panels will produce a better result than using a single higher-order panel that takes up the same width
-
The best implimentation is to use an array of panels, modulated with correct inverses arranged via the Barker code.
Opinion only: For a small number of repeats, say four or less, you can probably do away with modulation.
There are a few things that are not immediately apparent from the drawings...
- The lobes are generated by having multiple repeating panels, NOT by the specific pattern of a particular QRD
- The drawings are at the HF cutoff frequency of typical N7 panels - at other frequencies, the number of lobes and their angles will be different
- The HF cutoff frequency of the panels decreases substantially as the signal angle departs from straight-on.
- For signals that are not straight-on to the panels, the lobes angles and spacing will be different.
Lobes for periodic surfaces
Diffusion lobes occur when a number of repeats of a periodic surface are placed together in a sequence.
The maths presented here was published by
Cox and D'Antonio
, but it was illustrated more clearly in Naziema Joeman's 2005 thesis:
Diffuser performance analysis by measured-based modelling.
1.6Mb pdf
Some simple geometry is sufficient to illustrate the principle...
The following drawing shows a signal reflected from the same position on adjacent instances of periodic surface.
The difference in path lengths is given by A-B.
When this difference is an exact multiple of the wavelength of the signal, re-inforcement occurs, producing a lobe.
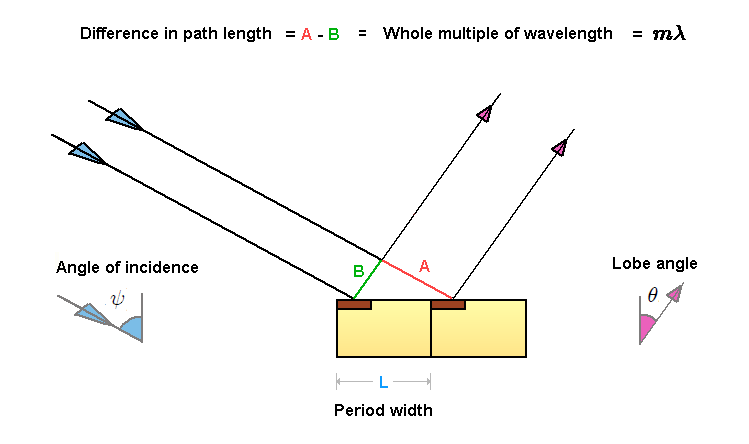
- As the frequency of the incoming signal changes, so does the angle of the lobe.
- As the angle of incidence is changed, the lobe angle also changes
- The lowest frequency lobe supported is when the signal wavelength equals the period width. (for a signal straight-on)
- At higher frequencies, additional lobes occur each time a higher multiple of the wavelength will fit into the period width
- Lobes occur in pairs - one with a positive angle and one with a negative angle. The two angles are the same for a signal straight-on, but are different when the angle of incidence is non-zero
Both the angle of incidence and the resulting lobe angles are measured from straight-on to the panel:
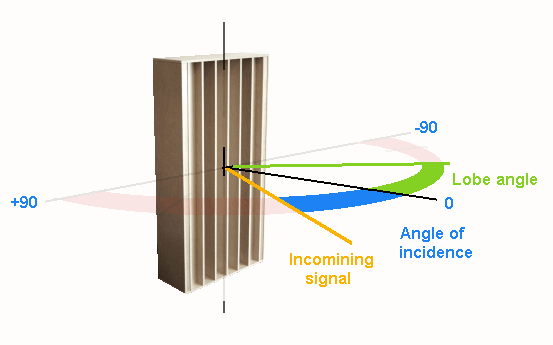
The mathematical releationship can be derived directly from the drawing:
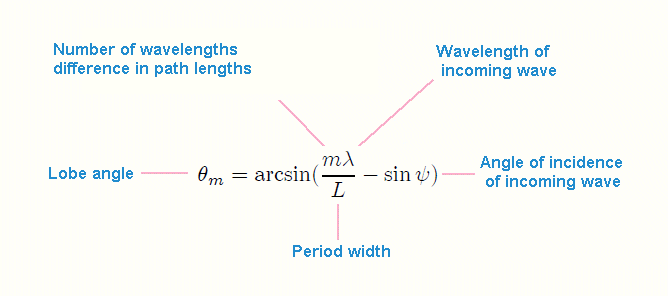
The next drawing takes the middle lobe diagram presented at the start of this page, rotates it 90 degrees and adds the lobe numbers that correspond to this equation
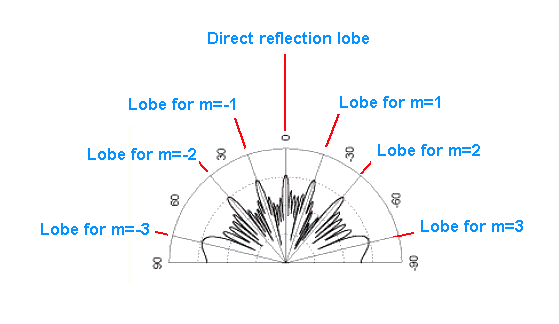
Lobe drawing for multiple N7 panels at the HF cutoff frequency
This can be simplified by drawing just the main lobes as rays along their axis. We'll further simplify by examining just the first pair of lobes - those that will be used in the drawings for the next section.
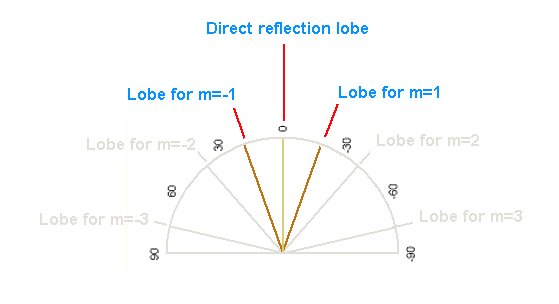
Simplified lobe drawing
The lobe drawings seen so far are a for a group of N7 panels at a single frequency - the HF cutoff frequency. The next section looks at how the highlighted pair of lobes behave over an entire frequency range.
f_period is the frequency whose wavelength equals the period width of one of the repeating surfaces.
For multiple panels, with the signal straight-on, it is the frequency at which the first pair of lobes appear. This is due to it having a wavelength equal to to the distance from a given point on one panel to the same point on the adjacent panel. Subsequent pairs appear at multiples of this frequency. When the angle of incidence is not zero, the starting frequencies for the lobes shift, but they're still related to f_period.
Since the first part of this page deals with periodic surfaces only, it is best to use f_period for the analysis, as opposed to design frequency, which only has relevance when the concepts developed are extended to QRD panels.
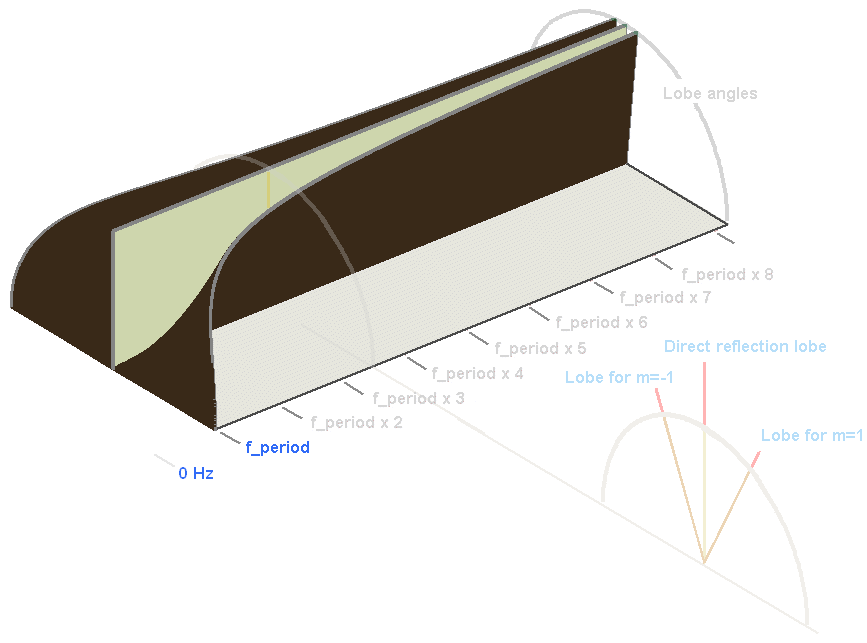
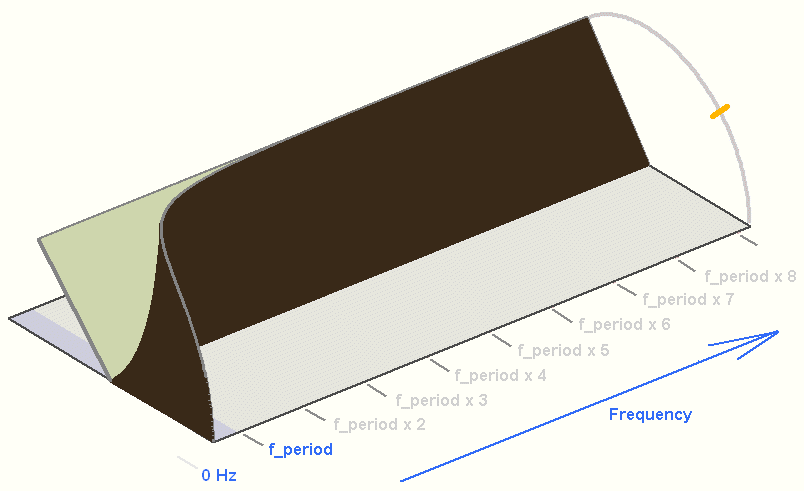
The following series of drawings show how the lobe angles vary with frequency
The first drawing is for a signal straight-on to the panels, and for clarity, shows
only the first pair of lobes that are sustainable
(ie m = +1 and m=-1 from the above equation).
The lobes first appear at f_period, where there is a lobe at +90 degrees and one at -90 degrees, both shown in brown.
As the frequency rises, the lobe angles decrease, approaching zero degrees at very high frequencies.
The vertical plane shown in beige is the direct reflection lobe, which is always at the opposite angle to the incoming signal, and
doesn't vary with frequency (m=0).
The frequency range chosen for the drawing is arbitrary - an upper frequency of f_period * 9 will provide plenty of room
to add to the drawing as we progress down the page.
Drawn ghosted is a slice through the drawing at f_period * 3.5, which is the approximate HF cutoff frequency of an N7 panel.
It can be seen that the slice is the same as the simplified lobe drawing displayed earlier on this page.
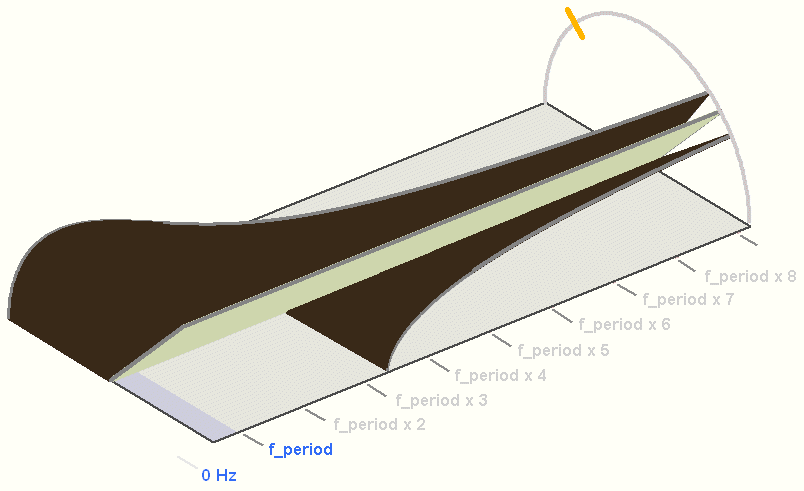
The next drawing shows the result with the signal striking the panels at 45 degrees
, as indicated by the orange tick on the grey arc at the RHS of the drawing.
The beige direct reflection lobe has moved in the opposite direction by the same angle.
The brown lobes have also moved.
Imagine the drawing as a physical object that has been rotated towards the back of
the view.
(Note: the rotation is not actually linear - the spacing between lobes changes)
The lobe at the front now has more of itself exposed above the "deck", whilst the lobe at the back has less exposed.
(not visible in this view)
In addition, the front lobe now begins at a frequency lower than f_period. This extra coverage of the spectrum
is highlighted by the light-blue shading on the "deck"
To see the lobe at the back, model the opposite angle. Here is the situation for minus 45 degrees. The lobe that was shown at the back of the previous drawing is now visible at the front. It has effectively moved sideways in the opposite direction to the lobe on the other side of the panel, now starting at a frequency that is quite a bit higher than its original value of f_period.
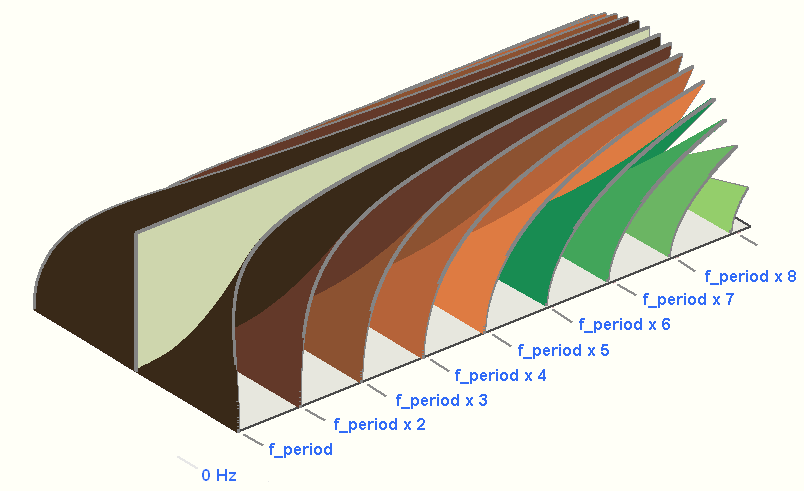
Returning now to the first drawing with the signal straight-on, and adding some more lobes...
With the signal straight-on, an extra pair of lobes appear at each multiple of f_period.
For example at f_period * 2, lobes appear that correspond to m equals plus or minus 2 in the earlier equation.
At f_period * 3, lobes appear that correspond to m equals plus or minus 3 and so on...
This process continues upwards until the frequency is beyond the range of interest.
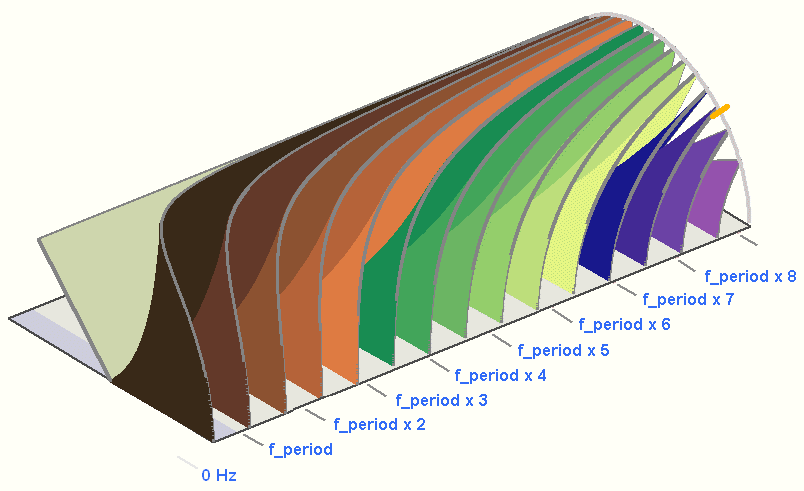
Here is the response for an angle of incidence equal to 45 degrees, as before. The same tilting and sideways movement of the lobes seen in the simpler earlier drawing can be seen here too.
Lobes for QRD panels
First some revision on stand-alone QRD panels
Low frequency limits
The lowest diffusion frequency for a single QRD panel is the design frequency,
provided the design frequency is greater than f_period.
Just why this limit exists is not covered by Cox and D'Antonio, but they do present a drawing showing how a panel
that is too narrow for its design frequency will not diffuse below f_period (even though they don't name it as such).
They clearly state that this is for "a panel", not multiple panels.
If the design frequency is less than f_period (ie the wells are too narrow), the lowest diffusion frequency becomes f_period.
It is generally accepted that scattering can take place down to one octave below the lowest diffusion frequency. In this
range, the panel is still working, but does not have the same potential for equal energy lobes.
The end of the the scattering range marks the LF cutoff frequency of the panel
Below the LF cutoff frequency, the panel acts as a flat wall.
High frequency limits
The HF cutoff is that frequency whose half-wavelength is not less than the well width. This situation
changes with angle of incidence and will be covered in the next section.
The second HF limit is the plate frequency, which is the design frequency times the panel order (number of wells).
If the plate frequency is lower than the well-width defined HF cutoff, then the plate frequency becomes the new limit.
Here are these ranges for QRDude's default N7 panel...
This shot is from QRDude's Usable ranges explorer.
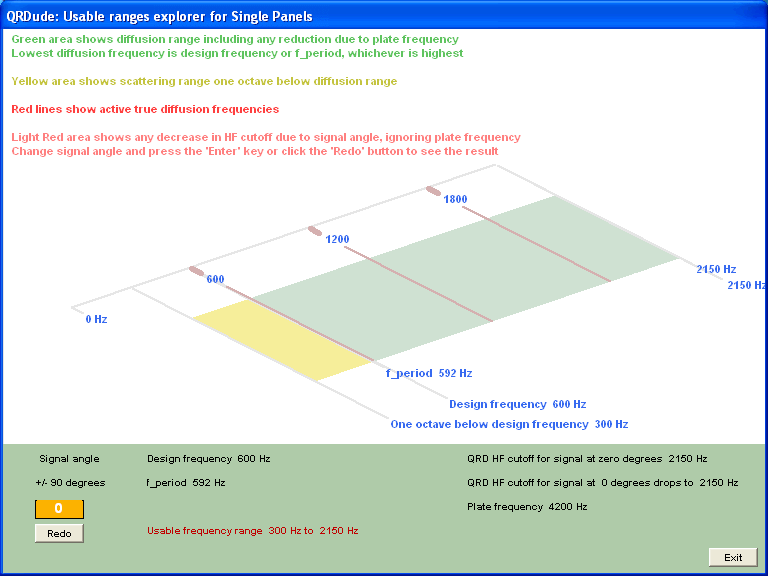
The Usable ranges explorer is new for Version 3 and is accessible from
the 'explore' link located at the right of the frequency ranges field on the main screen.

Diffusion range for multiple panels
For single panels, the usable ranges screen shows the transition from scattering to diffusion.
When used in the context of multiple panels however, these ranges merely indicate what style of scattering / diffusion energy
is available to energise the multi-panel lobes.
The actual diffusion range now starts where the lobes start, provided this is within the usable range
of the underlying panels, otherwise it starts at the bottom of the usable range.
In cases where the lobes are not present at the start of the usable range, the response is the scattering of
the underlying single panels until the lobes do take over.
Because the diffusion starting frequency for multiple panels may be different to that of single panel,
it is listed in the information panel at the bottom of the screen, along with a revised minimum seating
distance.
Switching now to the Lobe screen, also new for Version 3, which is accesible
from the menu bar on QRDude's main screen.

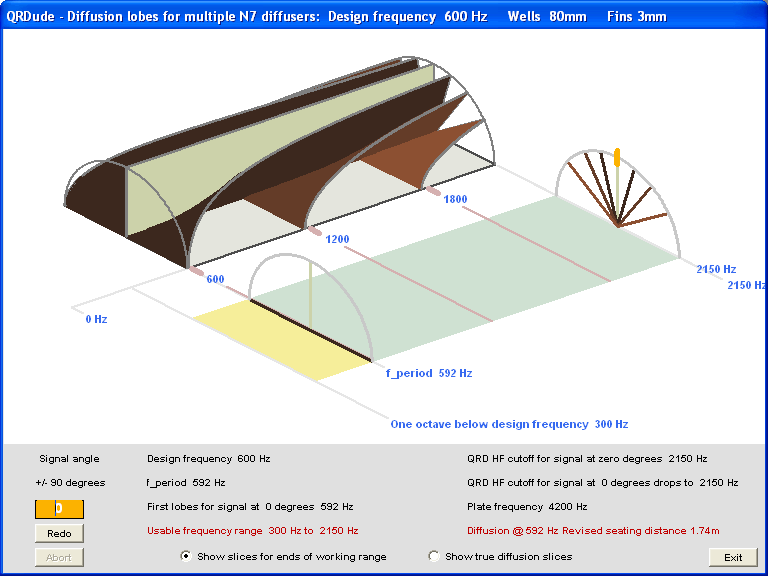
The lobes screen shows the multi-panel lobes at the back of the drawing, and a copy of the usable ranges explorer
screen at the front.
The light-green area shows that diffused energy is availble to power the lobes from 600 - 2150 Hz.
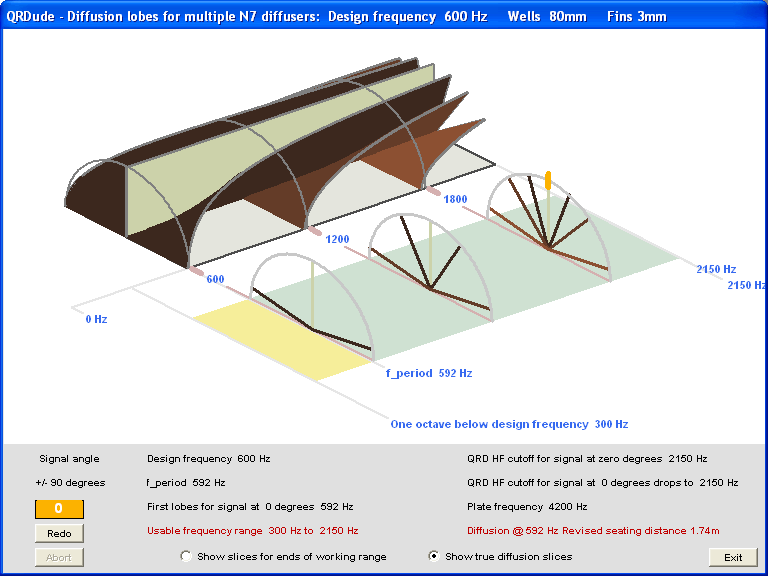
The red lines are
the "true diffusion" frequencies that are multiples of the design frequency. These are the frequencies at which the energy is
equal in all the lobes.
Opinion only: I've not been able to find out what happens at the frequencies in between, but it is most likely
that the lobes vary in their respective energies.
The yellow area shows that scattered energy is availble to power lobes from 300 - 600 Hz..
Lobes only exist down to 592 Hz, so this range is tiny. Below 592 Hz, there are no lobes, so the overall pattern
reverts back to that of a single panel, which in this case is just scattering.
At either end of the usable frequency range are the cross-section slices showing the arrangement of the lobes.
In this example, the bottom slice is drawn where the lobes begin rather than at the bottom of the usable range because
there aren't any lobes at the LF cutoff frequency.
This slice shows 3 lobes (including the direct reflection lobe).
At the HF cutoff, there are seven lobes, arranged symmetrically. Note that this slice is a simplified version of
the lobe drawing presented way back at the start of this page
The maximum number of lobes for a QRD panel is usually stated as being the same as the panel order, but this
appears only to be true for zero-width theoretical fins. If the fin width is a significant proportion of
the size of the well width (say 25%), then additional lobes can intrude at the upper end due to the larger period width.
This usually is not the case till the panel order gets up above about N17.
True diffusion frequencies
The same panel with the option selected to show the slices for the "true diffusion" frequencies
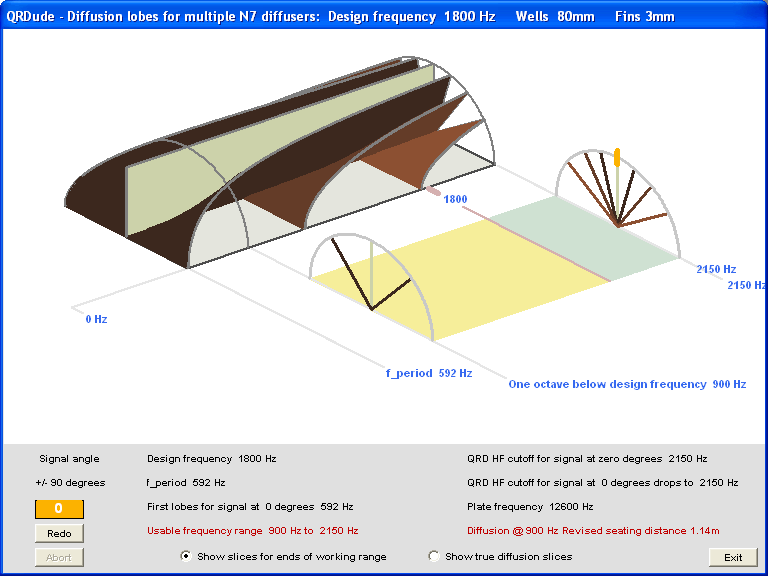
Width left the same, frequency increased
Well widths the same, design frequency raised to 1800, to show how the LF cutoff is taken to be one octave below the design frequency. Diffusion is available right down to the bottom of the usable range.
Width left the same, frequency decreased so Plate frequency becomes an issue.
Well widths are still the same, design frequency lowered to 200hz, making the plate frequency of 1400hz lower than the original HF cutoff, so setting the new upper limit. Note that the slice at the plate frequency shows that the lobes have collapsed.
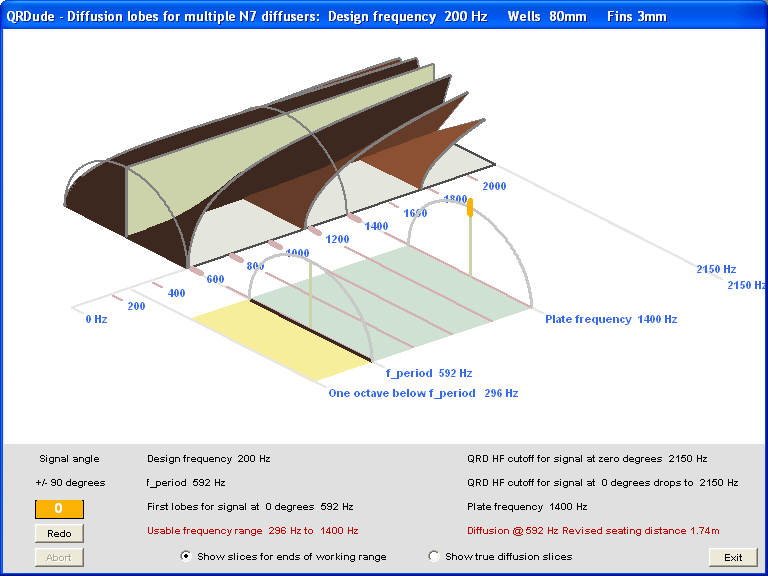
Since the design frequency is lower than f_period, the lower limit for single-panel diffusion becomes f_period. In this example, the diffusion starting frequency is the same for multiple panels as it is for a single panel. The LF cutoff frequency is one octave below this, with the wording of the label at that point reflecting the change.
Reduction in QRD panel HF cutoff frequency caused by angle of incidence
The width of the wells determines the High Frequency (HF) cutoff frequency,
where the width represents one half-wavelength
This is only true for the incoming signal straight-on. For other angles of incidence, the HF cutoff frequency is decreased,
according to the following equation:
See the feature panel on the qrd overview page for a
detailed explanation of how this works.
The amount of adjustment depends on the angle of incidence. When the angle reaches +/-90 degrees,
the HF cutoff falls to zero, meaning no diffusion.
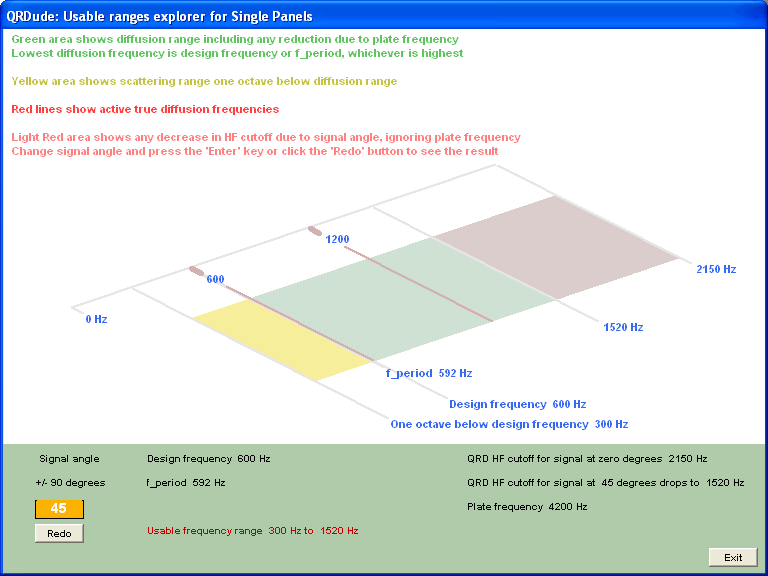
Angle of incidence changed from zero to 45 degrees
Here is the default N7 panel on the Usable ranges explorer screen, but modelled with the signal angle set to 45 degrees. The light-red shaded area shows the resulting decrease in the HF cutoff frequency.
Switching to the Lobes screen shows how the signal angle has also changed the lobe starting frequencies.
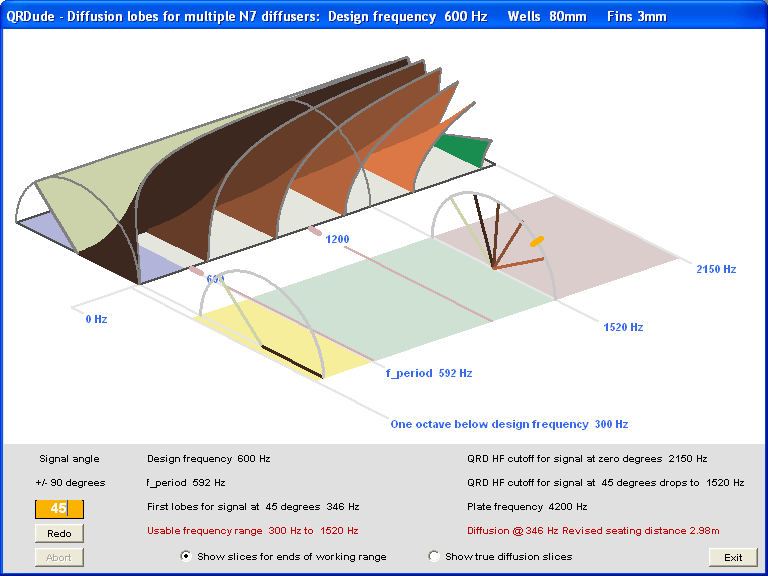
The usable range still begins at 300hz, but the HF cutoff is reduced to 1520hz. This has eliminated support for the
true diffusion frequency that had been at 1800Hz
The starting frequency for the first lobe has dropped from 592Hz, (the value of f_period), to 346Hz,
as highlighted by the light-blue shaded area on the "floor" of the lobes area.
Some of the figures are left off the graph to keep it readable when several labels would overlap.
The value for the first lobe starting frequency is found in the information panel at the bottom of the screen.
Some extra lobes have appeared due to the lowered starting frequencies for all lobes on the same
side of the panel as the incoming signal.
Diffusion is available from 346Hz, with the region of "single-panel" style scattering
just the small range from 300hz to 346hz.
The other side
Changing the angle to minus 45 degrees shows the lobes on the other side of the panel.
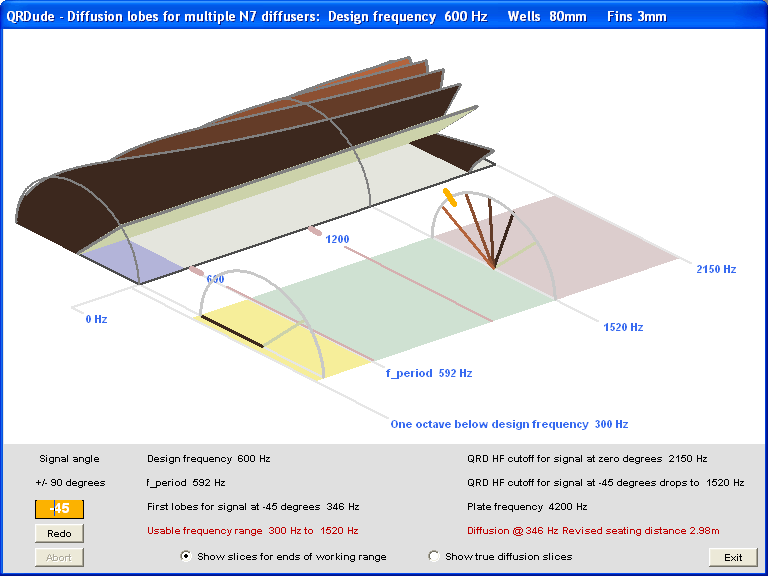
Lobes on the side of the panel opposite the incoming signal, increase their starting frequencies as the angle of
incidence increases. This view shows that the process has moved them beyond the usable range
The example covered by these three shots is roughly what you get with panels at the first reflection points
on side walls of a room.
The reduction in the HF cutoff frequency, plus the increased seating distance are two reasons why QRDs are not
necessarily recommended in such locations. For long rooms where the angle may be closer to 60 degrees,
the situation is even worse.
Incidence animated...
Here is a short animation showing how the lobes and frequency range changes for a standard N13 as the angle of incidence is varied
A fancy one to finish with
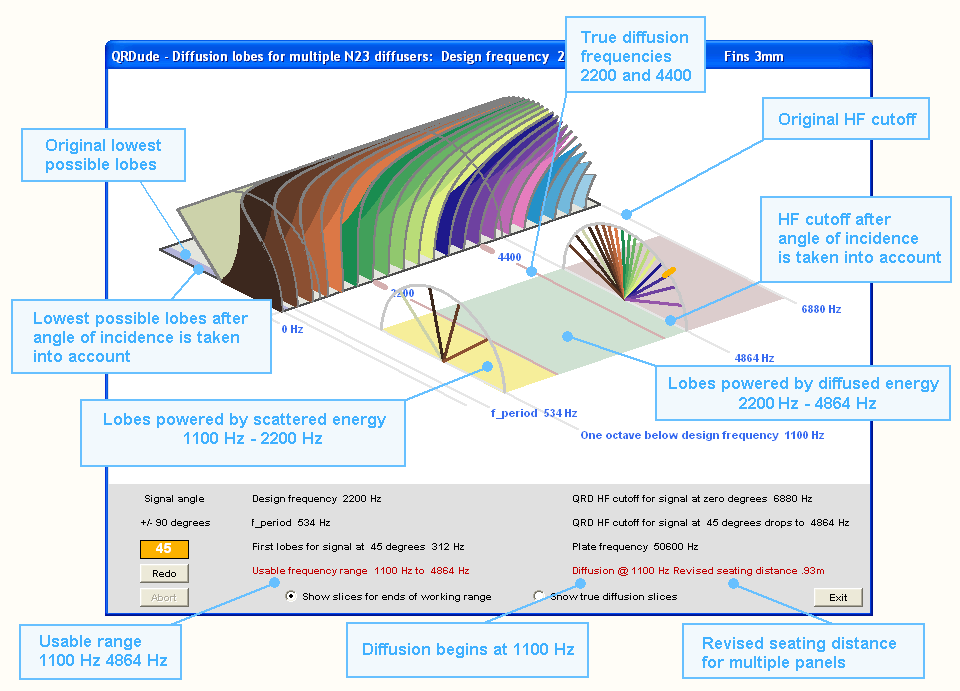
Here's a marked-up N23 showing all these principles...
Additional QRDude pages:

